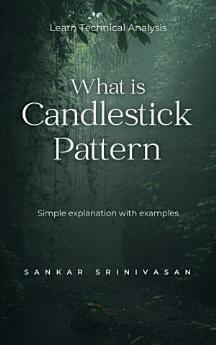
What is Candlestick Pattern?
thg 4 2023 · Srinivasan Sankara Narayanan
Sách điện tử
20
Trang
reportĐiểm xếp hạng và bài đánh giá chưa được xác minh Tìm hiểu thêm
Giới thiệu về sách điện tử này
Candlestick patterns are a type of charting technique used in financial analysis to help traders and investors better understand market movements. They provide a visual representation of price action by showing the opening, high, low, and closing prices of an asset over a period of time. Candlestick patterns are formed by a series of candles on a price chart, with each candle representing a specific time period. The body of the candle represents the price range between the opening and closing prices for that period, while the wicks or shadows represent the high and low prices for the same period. Candlestick patterns can be bullish or bearish depending on the direction of the market trend. A bullish pattern indicates that the market is likely to rise, while a bearish pattern indicates that the market is likely to fall.
This mini ebook is simple explanation of Candlestick patterns, written by Sankar Srinivasan, Certified Market Professional of National Stock Exchange of India
Xếp hạng sách điện tử này
Cho chúng tôi biết suy nghĩ của bạn.
Đọc thông tin
Điện thoại thông minh và máy tính bảng
Cài đặt ứng dụng Google Play Sách cho Android và iPad/iPhone. Ứng dụng sẽ tự động đồng bộ hóa với tài khoản của bạn và cho phép bạn đọc trực tuyến hoặc ngoại tuyến dù cho bạn ở đâu.
Máy tính xách tay và máy tính
Bạn có thể nghe các sách nói đã mua trên Google Play thông qua trình duyệt web trên máy tính.
Thiết bị đọc sách điện tử và các thiết bị khác
Để đọc trên thiết bị e-ink như máy đọc sách điện tử Kobo, bạn sẽ cần tải tệp xuống và chuyển tệp đó sang thiết bị của mình. Hãy làm theo hướng dẫn chi tiết trong Trung tâm trợ giúp để chuyển tệp sang máy đọc sách điện tử được hỗ trợ.


