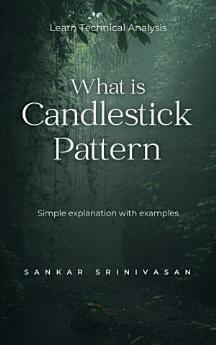
What is Candlestick Pattern?
апр. 2023 г. · Srinivasan Sankara Narayanan
Электронная книга
20
Количество страниц
reportОценки и отзывы не проверены. Подробнее…
Об электронной книге
Candlestick patterns are a type of charting technique used in financial analysis to help traders and investors better understand market movements. They provide a visual representation of price action by showing the opening, high, low, and closing prices of an asset over a period of time. Candlestick patterns are formed by a series of candles on a price chart, with each candle representing a specific time period. The body of the candle represents the price range between the opening and closing prices for that period, while the wicks or shadows represent the high and low prices for the same period. Candlestick patterns can be bullish or bearish depending on the direction of the market trend. A bullish pattern indicates that the market is likely to rise, while a bearish pattern indicates that the market is likely to fall.
This mini ebook is simple explanation of Candlestick patterns, written by Sankar Srinivasan, Certified Market Professional of National Stock Exchange of India
Оцените электронную книгу
Поделитесь с нами своим мнением.
Где читать книги
Смартфоны и планшеты
Установите приложение Google Play Книги для Android или iPad/iPhone. Оно синхронизируется с вашим аккаунтом автоматически, и вы сможете читать любимые книги онлайн и офлайн где угодно.
Ноутбуки и настольные компьютеры
Слушайте аудиокниги из Google Play в веб-браузере на компьютере.
Устройства для чтения книг
Чтобы открыть книгу на таком устройстве для чтения, как Kobo, скачайте файл и добавьте его на устройство. Подробные инструкции можно найти в Справочном центре.


