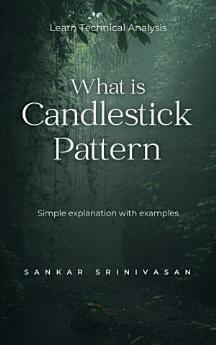
What is Candlestick Pattern?
აპრ. 2023 · Srinivasan Sankara Narayanan
ელწიგნი
20
გვერდი
reportრეიტინგები და მიმოხილვები დაუდასტურებელია შეიტყვეთ მეტი
ამ ელწიგნის შესახებ
Candlestick patterns are a type of charting technique used in financial analysis to help traders and investors better understand market movements. They provide a visual representation of price action by showing the opening, high, low, and closing prices of an asset over a period of time. Candlestick patterns are formed by a series of candles on a price chart, with each candle representing a specific time period. The body of the candle represents the price range between the opening and closing prices for that period, while the wicks or shadows represent the high and low prices for the same period. Candlestick patterns can be bullish or bearish depending on the direction of the market trend. A bullish pattern indicates that the market is likely to rise, while a bearish pattern indicates that the market is likely to fall.
This mini ebook is simple explanation of Candlestick patterns, written by Sankar Srinivasan, Certified Market Professional of National Stock Exchange of India
შეაფასეთ ეს ელწიგნი
გვითხარით თქვენი აზრი.
ინფორმაცია წაკითხვასთან დაკავშირებით
სმარტფონები და ტაბლეტები
დააინსტალირეთ Google Play Books აპი Android და iPad/iPhone მოწყობილობებისთვის. ის ავტომატურად განახორციელებს სინქრონიზაციას თქვენს ანგარიშთან და საშუალებას მოგცემთ, წაიკითხოთ სასურველი კონტენტი ნებისმიერ ადგილას, როგორც ონლაინ, ისე ხაზგარეშე რეჟიმში.
ლეპტოპები და კომპიუტერები
Google Play-ში შეძენილი აუდიოწიგნების მოსმენა თქვენი კომპიუტერის ვებ-ბრაუზერის გამოყენებით შეგიძლიათ.
ელწამკითხველები და სხვა მოწყობილობები
ელექტრონული მელნის მოწყობილობებზე წასაკითხად, როგორიცაა Kobo eReaders, თქვენ უნდა ჩამოტვირთოთ ფაილი და გადაიტანოთ იგი თქვენს მოწყობილობაში. დახმარების ცენტრის დეტალური ინსტრუქციების მიხედვით გადაიტანეთ ფაილები მხარდაჭერილ ელწამკითხველებზე.


