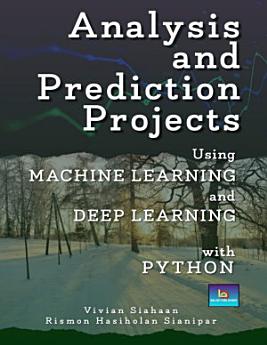
ANALYSIS AND PREDICTION PROJECTS USING MACHINE LEARNING AND DEEP LEARNING WITH PYTHON
About this ebook
In finance, default is failure to meet the legal obligations (or conditions) of a loan, for example when a home buyer fails to make a mortgage payment, or when a corporation or government fails to pay a bond which has reached maturity. A national or sovereign default is the failure or refusal of a government to repay its national debt.
The dataset used in this project belongs to a Hackathon organized by "Univ.AI". All values were provided at the time of the loan application. Following are the features in the dataset: Income, Age, Experience, Married/Single, House_Ownership, Car_Ownership, Profession, CITY, STATE, CURRENT_JOB_YRS, CURRENT_HOUSE_YRS, and Risk_Flag. The Risk_Flag indicates whether there has been a default in the past or not.
The machine learning models used in this project are K-Nearest Neighbor, Random Forest, Naive Bayes, Logistic Regression, Decision Tree, Support Vector Machine, Adaboost, LGBM classifier, Gradient Boosting, XGB classifier, MLP classifier, and CNN 1D. Finally, you will plot boundary decision, ROC, distribution of features, feature importance, cross validation score, and predicted values versus true values, confusion matrix, learning curve, performance of the model, scalability of the model, training loss, and training accuracy.
PROJECT 2: AIRLINE PASSENGER SATISFACTION Analysis and Prediction Using Machine Learning and Deep Learning with Python
The dataset used in this project contains an airline passenger satisfaction survey. In this case, you will determine what factors are highly correlated to a satisfied (or dissatisfied) passenger and predict passenger satisfaction.
Below are the features in the dataset: Gender: Gender of the passengers (Female, Male); Customer Type: The customer type (Loyal customer, disloyal customer); Age: The actual age of the passengers; Type of Travel: Purpose of the flight of the passengers (Personal Travel, Business Travel); Class: Travel class in the plane of the passengers (Business, Eco, Eco Plus); Flight distance: The flight distance of this journey; Inflight wifi service: Satisfaction level of the inflight wifi service (0:Not Applicable;1-5); Departure/Arrival time convenient: Satisfaction level of Departure/Arrival time convenient; Ease of Online booking: Satisfaction level of online booking; Gate location: Satisfaction level of Gate location; Food and drink: Satisfaction level of Food and drink; Online boarding: Satisfaction level of online boarding; Seat comfort: Satisfaction level of Seat comfort; Inflight entertainment: Satisfaction level of inflight entertainment; On-board service: Satisfaction level of On-board service; Leg room service: Satisfaction level of Leg room service; Baggage handling: Satisfaction level of baggage handling; Check-in service: Satisfaction level of Check-in service; Inflight service: Satisfaction level of inflight service; Cleanliness: Satisfaction level of Cleanliness; Departure Delay in Minutes: Minutes delayed when departure; Arrival Delay in Minutes: Minutes delayed when Arrival; and Satisfaction: Airline satisfaction level (Satisfaction, neutral or dissatisfaction)
The machine learning models used in this project are K-Nearest Neighbor, Random Forest, Naive Bayes, Logistic Regression, Decision Tree, Support Vector Machine, LGBM classifier, Gradient Boosting, XGB classifier, MLP classifier, and CNN 1D. Finally, you will plot boundary decision, ROC, distribution of features, feature importance, cross validation score, and predicted values versus true values, confusion matrix, learning curve, performance of the model, scalability of the model, training loss, and training accuracy.
PROJECT 3: CREDIT CARD CHURNING CUSTOMER ANALYSIS AND PREDICTION USING MACHINE LEARNING AND DEEP LEARNING WITH PYTHON
The dataset used in this project consists of more than 10,000 customers mentioning their age, salary, marital_status, credit card limit, credit card category, etc. There are 20 features in the dataset. In the dataset, there are only 16.07% of customers who have churned. Thus, it's a bit difficult to train our model to predict churning customers.
Following are the features in the dataset: 'Attrition_Flag', 'Customer_Age', 'Gender', 'Dependent_count', 'Education_Level', 'Marital_Status', 'Income_Category', 'Card_Category', 'Months_on_book', 'Total_Relationship_Count', 'Months_Inactive_12_mon', 'Contacts_Count_12_mon', 'Credit_Limit', 'Total_Revolving_Bal', 'Avg_Open_To_Buy', 'Total_Amt_Chng_Q4_Q1', 'Total_Trans_Amt', 'Total_Trans_Ct', 'Total_Ct_Chng_Q4_Q1', and 'Avg_Utilization_Ratio',. The target variable is 'Attrition_Flag'.
The machine learning models used in this project are K-Nearest Neighbor, Random Forest, Naive Bayes, Logistic Regression, Decision Tree, Support Vector Machine, LGBM classifier, Gradient Boosting, XGB classifier, MLP classifier, and CNN 1D. Finally, you will plot boundary decision, ROC, distribution of features, feature importance, cross validation score, and predicted values versus true values, confusion matrix, learning curve, performance of the model, scalability of the model, training loss, and training accuracy.
PROJECT 4: MARKETING ANALYSIS AND PREDICTION USING MACHINE LEARNING AND DEEP LEARNING WITH PYTHON
This data set was provided to students for their final project in order to test their statistical analysis skills as part of a MSc. in Business Analytics. It can be utilized for EDA, Statistical Analysis, and Visualizations.
Following are the features in the dataset: ID = Customer's unique identifier; Year_Birth = Customer's birth year; Education = Customer's education level; Marital_Status = Customer's marital status; Income = Customer's yearly household income; Kidhome = Number of children in customer's household; Teenhome = Number of teenagers in customer's household; Dt_Customer = Date of customer's enrollment with the company; Recency = Number of days since customer's last purchase; MntWines = Amount spent on wine in the last 2 years; MntFruits = Amount spent on fruits in the last 2 years; MntMeatProducts = Amount spent on meat in the last 2 years; MntFishProducts = Amount spent on fish in the last 2 years; MntSweetProducts = Amount spent on sweets in the last 2 years; MntGoldProds = Amount spent on gold in the last 2 years; NumDealsPurchases = Number of purchases made with a discount; NumWebPurchases = Number of purchases made through the company's web site; NumCatalogPurchases = Number of purchases made using a catalogue; NumStorePurchases = Number of purchases made directly in stores; NumWebVisitsMonth = Number of visits to company's web site in the last month; AcceptedCmp3 = 1 if customer accepted the offer in the 3rd campaign, 0 otherwise; AcceptedCmp4 = 1 if customer accepted the offer in the 4th campaign, 0 otherwise; AcceptedCmp5 = 1 if customer accepted the offer in the 5th campaign, 0 otherwise; AcceptedCmp1 = 1 if customer accepted the offer in the 1st campaign, 0 otherwise; AcceptedCmp2 = 1 if customer accepted the offer in the 2nd campaign, 0 otherwise; Response = 1 if customer accepted the offer in the last campaign, 0 otherwise; Complain = 1 if customer complained in the last 2 years, 0 otherwise; and Country = Customer's location.
The machine and deep learning models used in this project are K-Nearest Neighbor, Random Forest, Naive Bayes, Logistic Regression, Decision Tree, Support Vector Machine, LGBM classifier, Gradient Boosting, XGB classifier, MLP classifier, and CNN 1D. Finally, you will plot boundary decision, ROC, distribution of features, feature importance, cross validation score, and predicted values versus true values, confusion matrix, learning curve, performance of the model, scalability of the model, training loss, and training accuracy.
PROJECT 5: METEOROLOGICAL DATA ANALYSIS AND PREDICTION USING MACHINE LEARNING WITH PYTHON
Meteorological phenomena are described and quantified by the variables of Earth's atmosphere: temperature, air pressure, water vapour, mass flow, and the variations and interactions of these variables, and how they change over time. Different spatial scales are used to describe and predict weather on local, regional, and global levels.
The dataset used in this project consists of meteorological data with 96453 total number of data points and with 11 attributes/columns. Following are the columns in the dataset: Formatted Date; Summary; Precip Type; Temperature (C); Apparent Temperature (C); Humidity; Wind Speed (km/h); Wind Bearing (degrees); Visibility (km); Pressure (millibars); and Daily Summary.
The machine learning models used in this project are K-Nearest Neighbor, Random Forest, Naive Bayes, Logistic Regression, Decision Tree, Support Vector Machine, LGBM classifier, Gradient Boosting, XGB classifier, and MLP classifier. Finally, you will plot boundary decision, distribution of features, feature importance, cross validation score, and predicted values versus true values, confusion matrix, learning curve, performance of the model, scalability of the model, training loss, and training accuracy.
Ratings and reviews
About the author
Vivian Siahaan is a fast-learner who likes to do new things. She was born, raised in Hinalang Bagasan, Balige, on the banks of Lake Toba, and completed high school education from SMAN 1 Balige. She started herself learning Java, Android, JavaScript, CSS, C ++, Python, R, Visual Basic, Visual C #, MATLAB, Mathematica, PHP, JSP, MySQL, SQL Server, Oracle, Access, and other programming languages. She studied programming from scratch, starting with the most basic syntax and logic, by building several simple and applicable GUI applications. Animation and games are fields of programming that are interests that she always wants to develop. Besides studying mathematical logic and programming, the author also has the pleasure of reading novels. Vivian Siahaan has written dozens of ebooks that have been published on Sparta Publisher: Data Structure with Java; Java Programming: Cookbook; C ++ Programming: Cookbook; C Programming For High Schools / Vocational Schools and Students; Java Programming for SMA / SMK; Java Tutorial: GUI, Graphics and Animation; Visual Basic Programming: From A to Z; Java Programming for Animation and Games; C # Programming for SMA / SMK and Students; MATLAB For Students and Researchers; Graphics in JavaScript: Quick Learning Series; JavaScript Image Processing Methods: From A to Z; Java GUI Case Study: AWT & Swing; Basic CSS and JavaScript; PHP / MySQL Programming: Cookbook; Visual Basic: Cookbook; C ++ Programming for High Schools / Vocational Schools and Students; Concepts and Practices of C ++; PHP / MySQL For Students; C # Programming: From A to Z; Visual Basic for SMA / SMK and Students; C # .NET and SQL Server for High School / Vocational School and Students. At the ANDI Yogyakarta publisher, Vivian Siahaan also wrote a number of books including: Python Programming Theory and Practice; Python GUI Programming; Python GUI and Database; Build From Zero School Database Management System In Python / MySQL; Database Management System in Python / MySQL; Python / MySQL For Management Systems of Criminal Track Record Database; Java / MySQL For Management Systems of Criminal Track Records Database; Database and Cryptography Using Java / MySQL; Build From Zero School Database Management System With Java / MySQL.
Rismon Hasiholan Sianipar was born in Pematang Siantar, in 1994. After graduating from SMAN 3 Pematang Siantar 3, the writer traveled to the city of Jogjakarta. In 1998 and 2001 the author completed his Bachelor of Engineering (S.T) and Master of Engineering (M.T) education in the Electrical Engineering of Gadjah Mada University, under the guidance of Prof. Dr. Adhi Soesanto and Prof. Dr. Thomas Sri Widodo, focusing on research on non-stationary signals by analyzing their energy using time-frequency maps. Because of its non-stationary nature, the distribution of signal energy becomes very dynamic on a time-frequency map. By mapping the distribution of energy in the time-frequency field using discrete wavelet transformations, one can design non-linear filters so that they can analyze the pattern of the data contained in it. In 2003, the author received a Monbukagakusho scholarship from the Japanese Government. In 2005 and 2008, he completed his Master of Engineering (M.Eng) and Doctor of Engineering (Dr.Eng) education at Yamaguchi University, under the guidance of Prof. Dr. Hidetoshi Miike. Both the master's thesis and his doctoral thesis, R.H. Sianipar combines SR-FHN (Stochastic Resonance Fitzhugh-Nagumo) filter strength with cryptosystem ECC (elliptic curve cryptography) 4096-bit both to suppress noise in digital images and digital video and maintain its authenticity. The results of this study have been documented in international scientific journals and officially patented in Japan. One of the patents was published in Japan with a registration number 2008-009549. He is active in collaborating with several universities and research institutions in Japan, particularly in the fields of cryptography, cryptanalysis and audio / image / video digital forensics. R.H. Sianipar also has experience in conducting code-breaking methods (cryptanalysis) on a number of intelligence data that are the object of research studies in Japan. R.H. Sianipar has a number of Japanese patents, and has written a number of national / international scientific articles, and dozens of national books. R.H. Sianipar has also participated in a number of workshops related to cryptography, cryptanalysis, digital watermarking, and digital forensics. In a number of workshops, R.H. Sianipar helps Prof. Hidetoshi Miike to create applications related to digital image / video processing, steganography, cryptography, watermarking, non-linear screening, intelligent descriptor-based computer vision, and others, which are used as training materials. Field of interest in the study of R.H. Sianipar is multimedia security, signal processing / digital image / video, cryptography, digital communication, digital forensics, and data compression / coding. Until now, R.H. Sianipar continues to develop applications related to analysis of signal, image, and digital video, both for research purposes and for commercial purposes based on the Python programming language, MATLAB, C ++, C, VB.NET, C # .NET, R, and Java.
