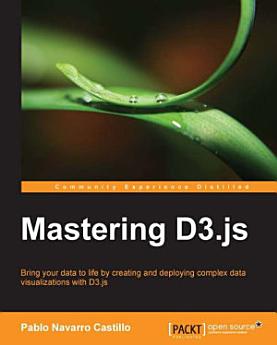
Mastering D3.js: Part 3
Pablo Navarro Castillo
2014 ഓഗ · Packt Publishing Ltd
4.3star
3 അവലോകനങ്ങൾreport
ഇ-ബുക്ക്
352
പേജുകൾ
reportറേറ്റിംഗുകളും റിവ്യൂകളും പരിശോധിച്ചുറപ്പിച്ചതല്ല കൂടുതലറിയുക
ഈ ഇ-ബുക്കിനെക്കുറിച്ച്
If you are a software developer working with data visualizations and want to build complex data visualizations, this book is for you. Basic knowledge of D3 framework is expected. With real-world examples, you will learn how to structure your applications to create enterprise-level charts and interactive dashboards.
റേറ്റിംഗുകളും റിവ്യൂകളും
4.3
3 റിവ്യൂകൾ
രചയിതാവിനെ കുറിച്ച്
Pablo Navarro Castillo is a mathematical engineer and developer. He earned his Master's degree in Applied Mathematics from École des Mines de Saint-Etienne in France. After working for a few years in operations research and data analysis, he began to work as a data visualization consultant and developer. He has collaborated with Packt Publishing as a technical reviewer for Data Visualization with D3.js and Data Visualization with D3.js Cookbook. In 2014, he founded Masega, which is a data visualization agency based in Santiago, Chile, where he currently works.
ഈ ഇ-ബുക്ക് റേറ്റ് ചെയ്യുക
നിങ്ങളുടെ അഭിപ്രായം ഞങ്ങളെ അറിയിക്കുക.
വായനാ വിവരങ്ങൾ
സ്മാർട്ട്ഫോണുകളും ടാബ്ലെറ്റുകളും
Android, iPad/iPhone എന്നിവയ്ക്കായി Google Play ബുക്സ് ആപ്പ് ഇൻസ്റ്റാൾ ചെയ്യുക. ഇത് നിങ്ങളുടെ അക്കൗണ്ടുമായി സ്വയമേവ സമന്വയിപ്പിക്കപ്പെടുകയും, എവിടെ ആയിരുന്നാലും ഓൺലൈനിൽ അല്ലെങ്കിൽ ഓഫ്ലൈനിൽ വായിക്കാൻ നിങ്ങളെ അനുവദിക്കുകയും ചെയ്യുന്നു.
ലാപ്ടോപ്പുകളും കമ്പ്യൂട്ടറുകളും
Google Play-യിൽ നിന്ന് വാങ്ങിയിട്ടുള്ള ഓഡിയോ ബുക്കുകൾ കമ്പ്യൂട്ടറിന്റെ വെബ് ബ്രൗസർ ഉപയോഗിച്ചുകൊണ്ട് വായിക്കാവുന്നതാണ്.
ഇ-റീഡറുകളും മറ്റ് ഉപകരണങ്ങളും
Kobo ഇ-റീഡറുകൾ പോലുള്ള ഇ-ഇങ്ക് ഉപകരണങ്ങളിൽ വായിക്കാൻ ഒരു ഫയൽ ഡൗൺലോഡ് ചെയ്ത് അത് നിങ്ങളുടെ ഉപകരണത്തിലേക്ക് കൈമാറേണ്ടതുണ്ട്. പിന്തുണയുള്ള ഇ-റീഡറുകളിലേക്ക് ഫയലുകൾ കൈമാറാൻ, സഹായ കേന്ദ്രത്തിലുള്ള വിശദമായ നിർദ്ദേശങ്ങൾ ഫോളോ ചെയ്യുക.


